Healthy Life Expectancy at birth
Period 2022 to 2024 — latest available
Source: ONS Healthy Life Expectancy (released Feb 2026) · Life Expectancy (released Dec 2025)
Seven slides exploring healthy life expectancy across London — scroll to advance.
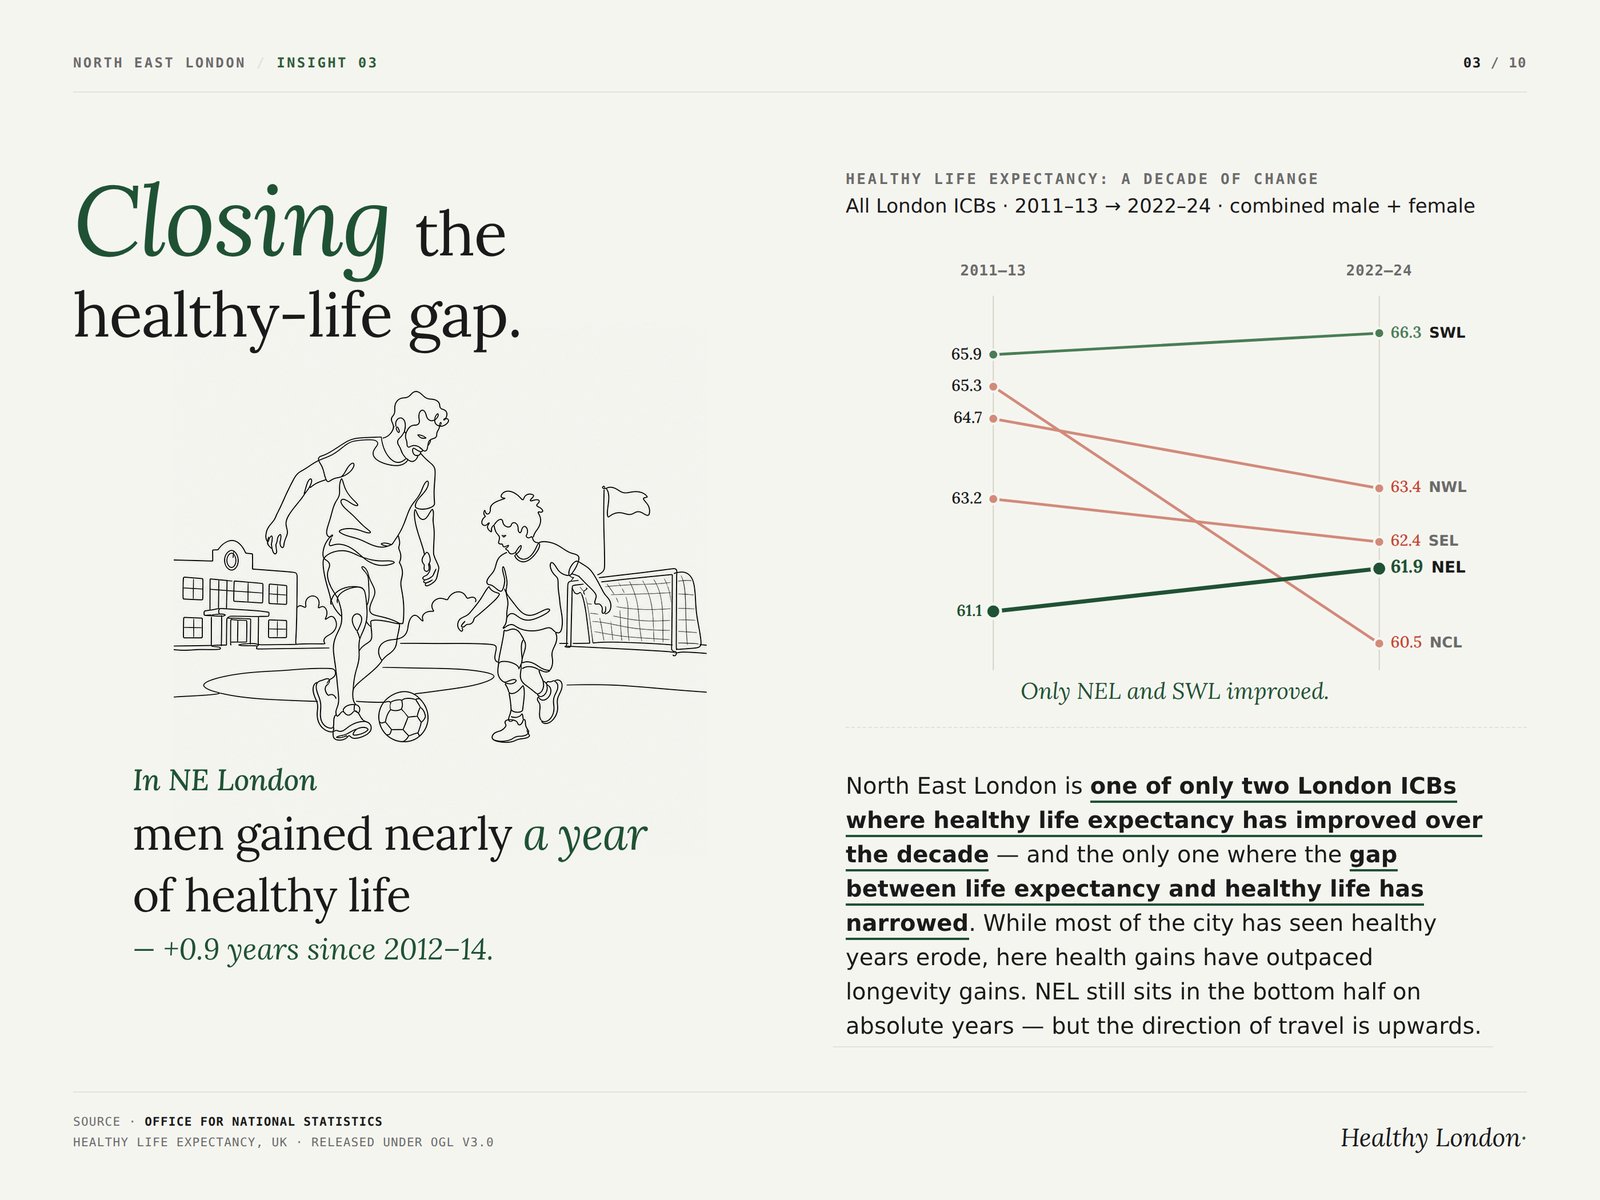
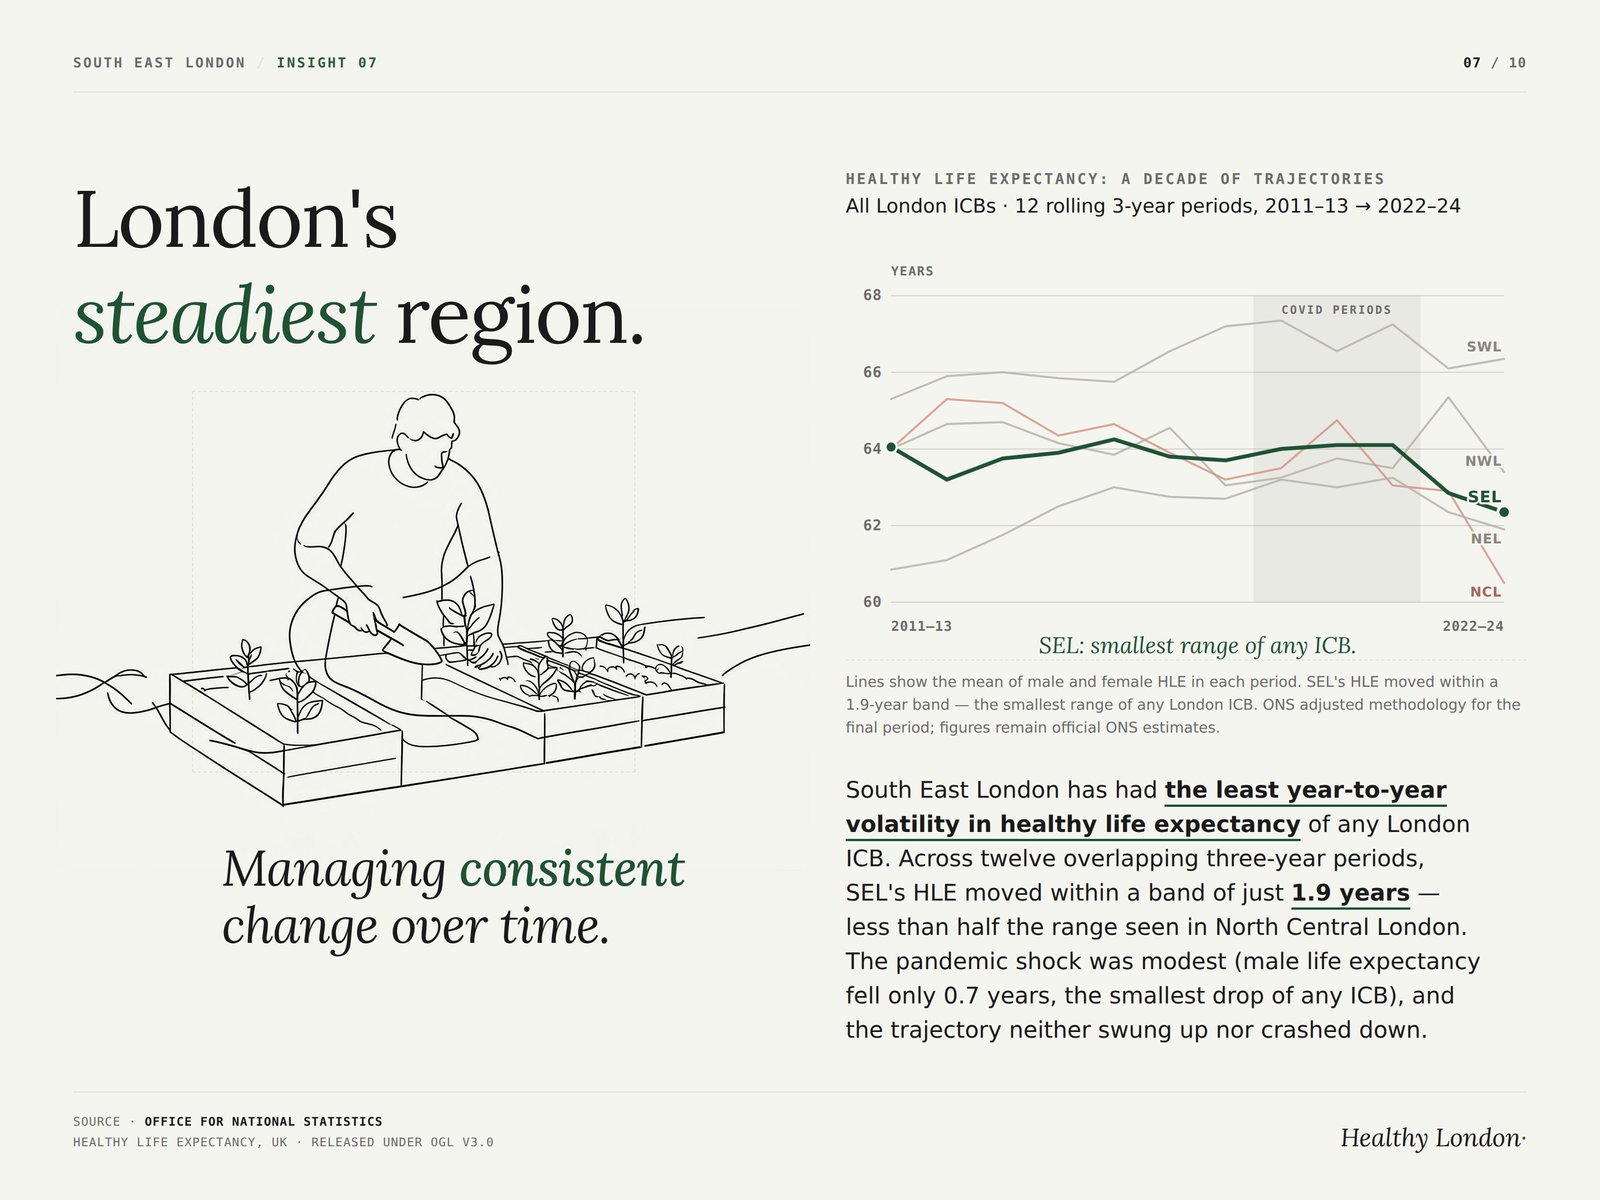
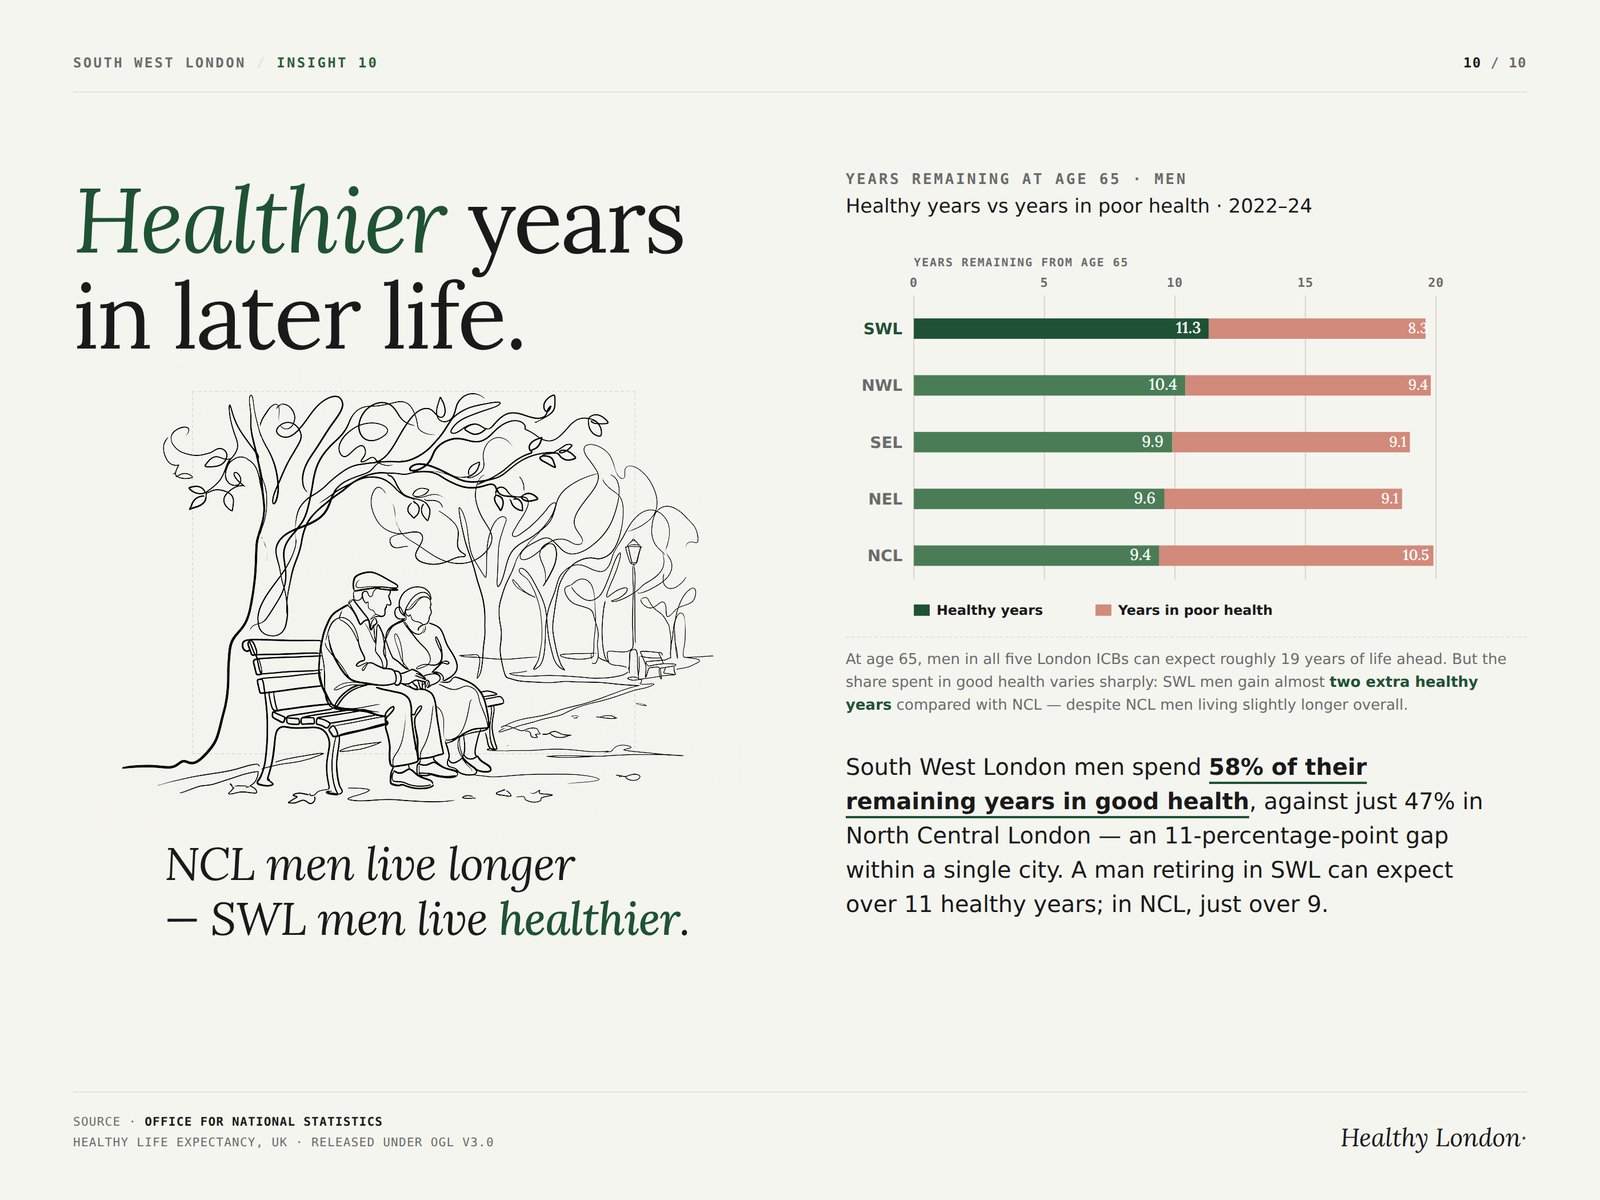
This visualization uses official statistics from the UK Office for National Statistics (ONS) to explore healthy life expectancy in London. Four ONS publications — covering life expectancy, healthy life expectancy, and population estimates — were combined into a single dataset focused on the five NHS Integrated Care Boards covering Greater London, across twelve 3-year periods from 2011–2013 to 2022–2024. All source data is publicly available and used under the Open Government Licence.
A few honest caveats are worth knowing as you explore the app. Healthy life expectancy is built partly from a survey that asks people to rate their own health, so the figures carry some uncertainty. The 2018–2020, 2019–2021, and 2020–2022 periods are affected by the COVID-19 pandemic, which temporarily lowered life expectancy. And ONS adjusted its methodology slightly for the most recent (2022–2024) figures because the underlying survey sample has shrunk; the figure remains the official estimate, but is not strictly comparable to earlier periods. The full methodology below covers these and other choices in detail.
This document describes how the consolidated dataset (london_icb_dataset.xlsx) was built from publicly-available ONS sources, what decisions were made along the way, and what was deliberately deferred to future iterations. It is intended as a transparent record for the development team and any third party reviewing the analysis.
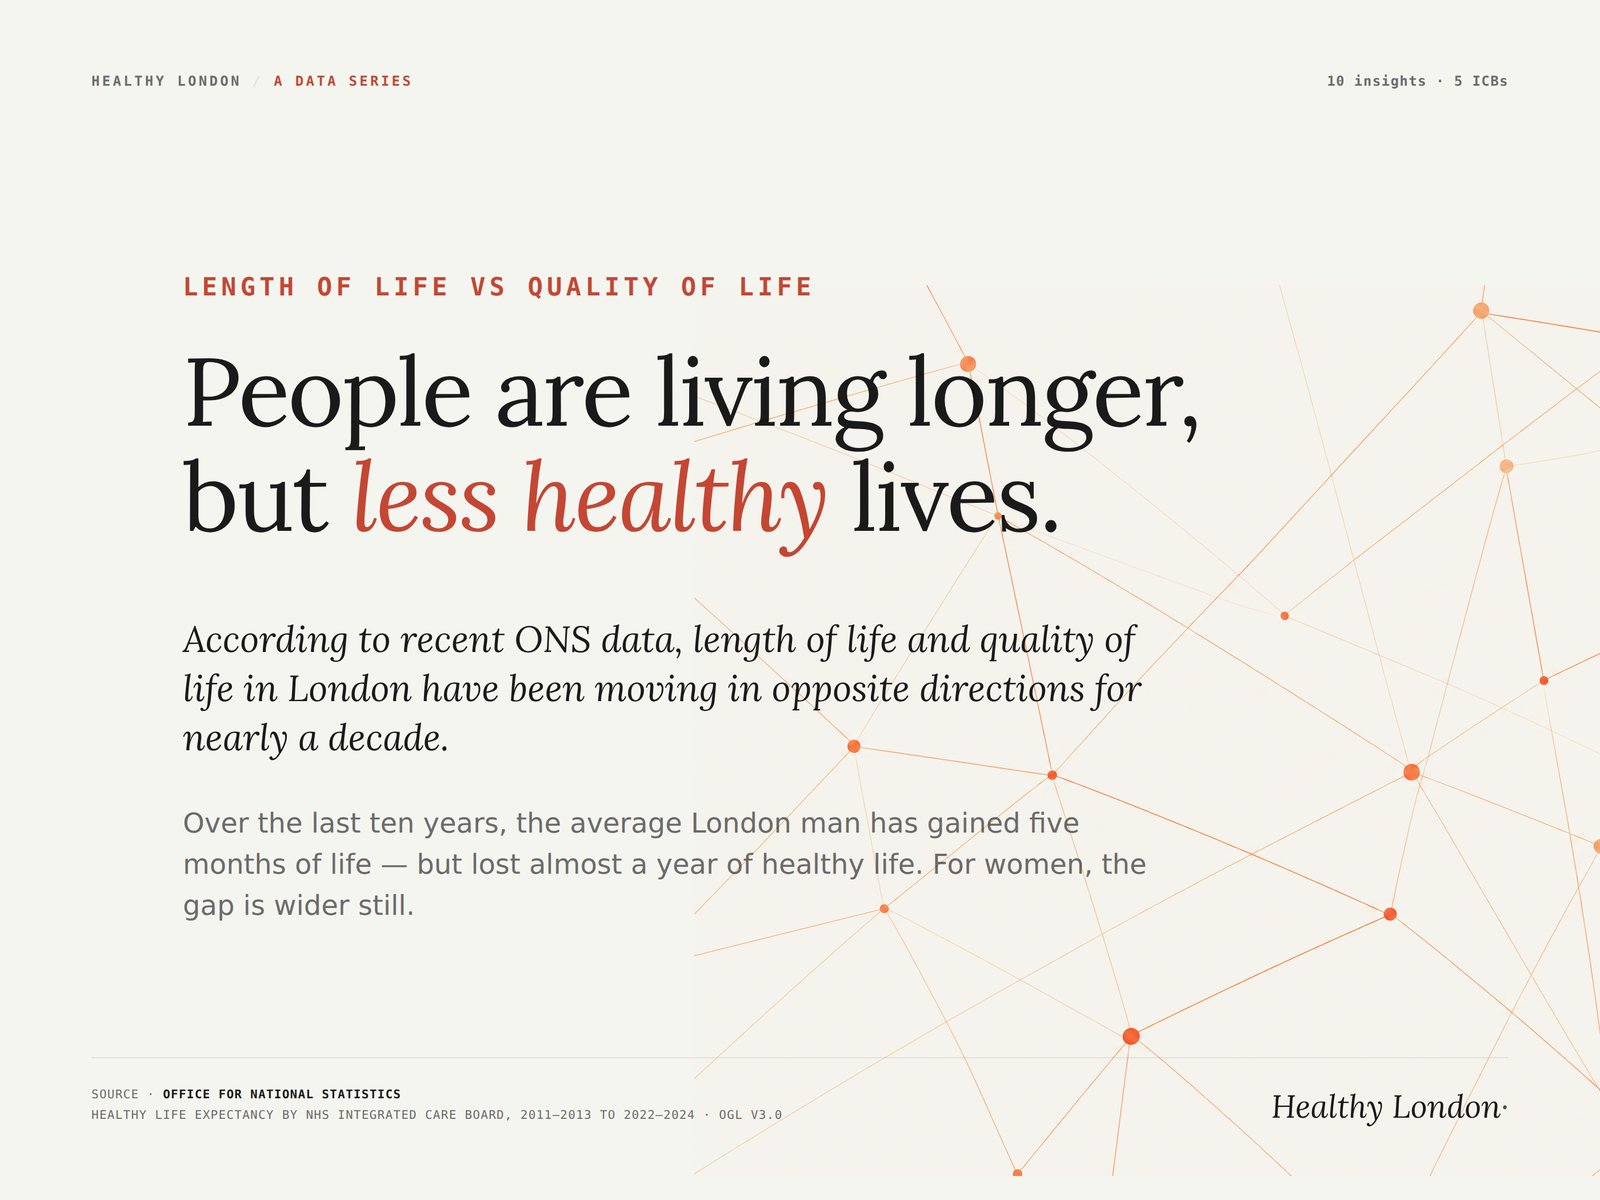
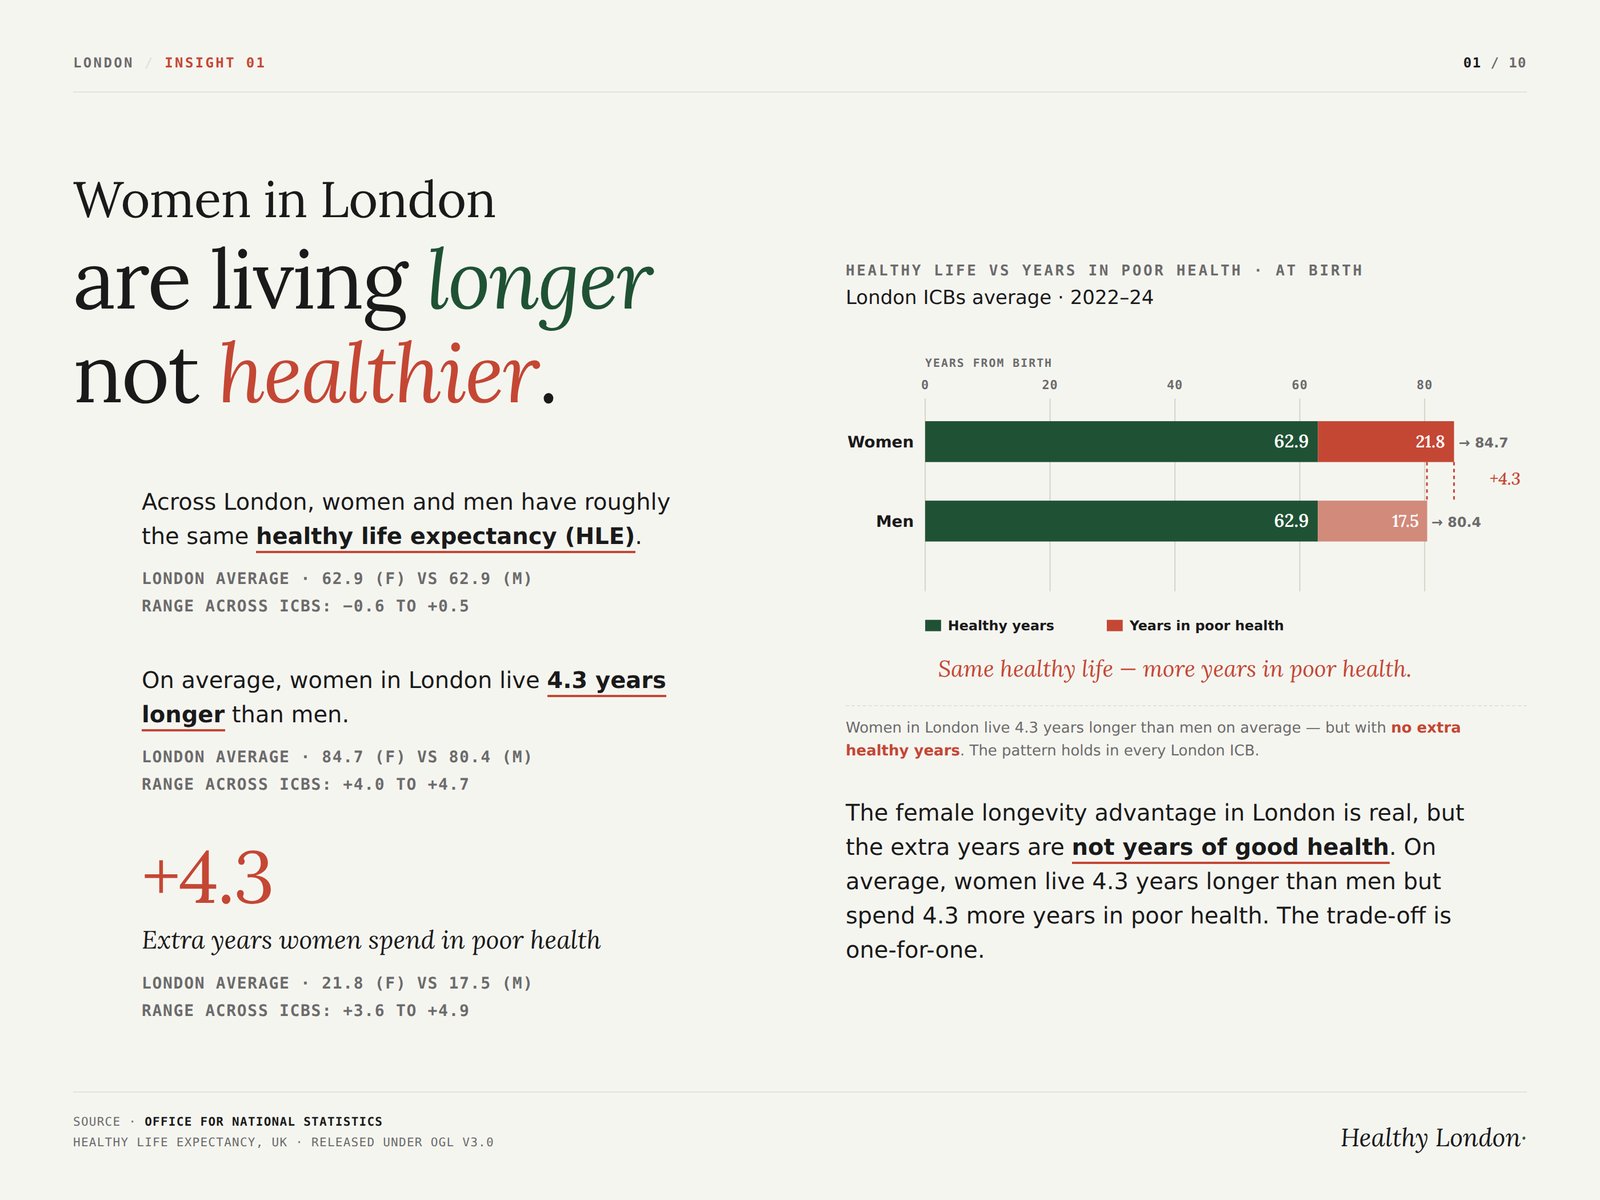
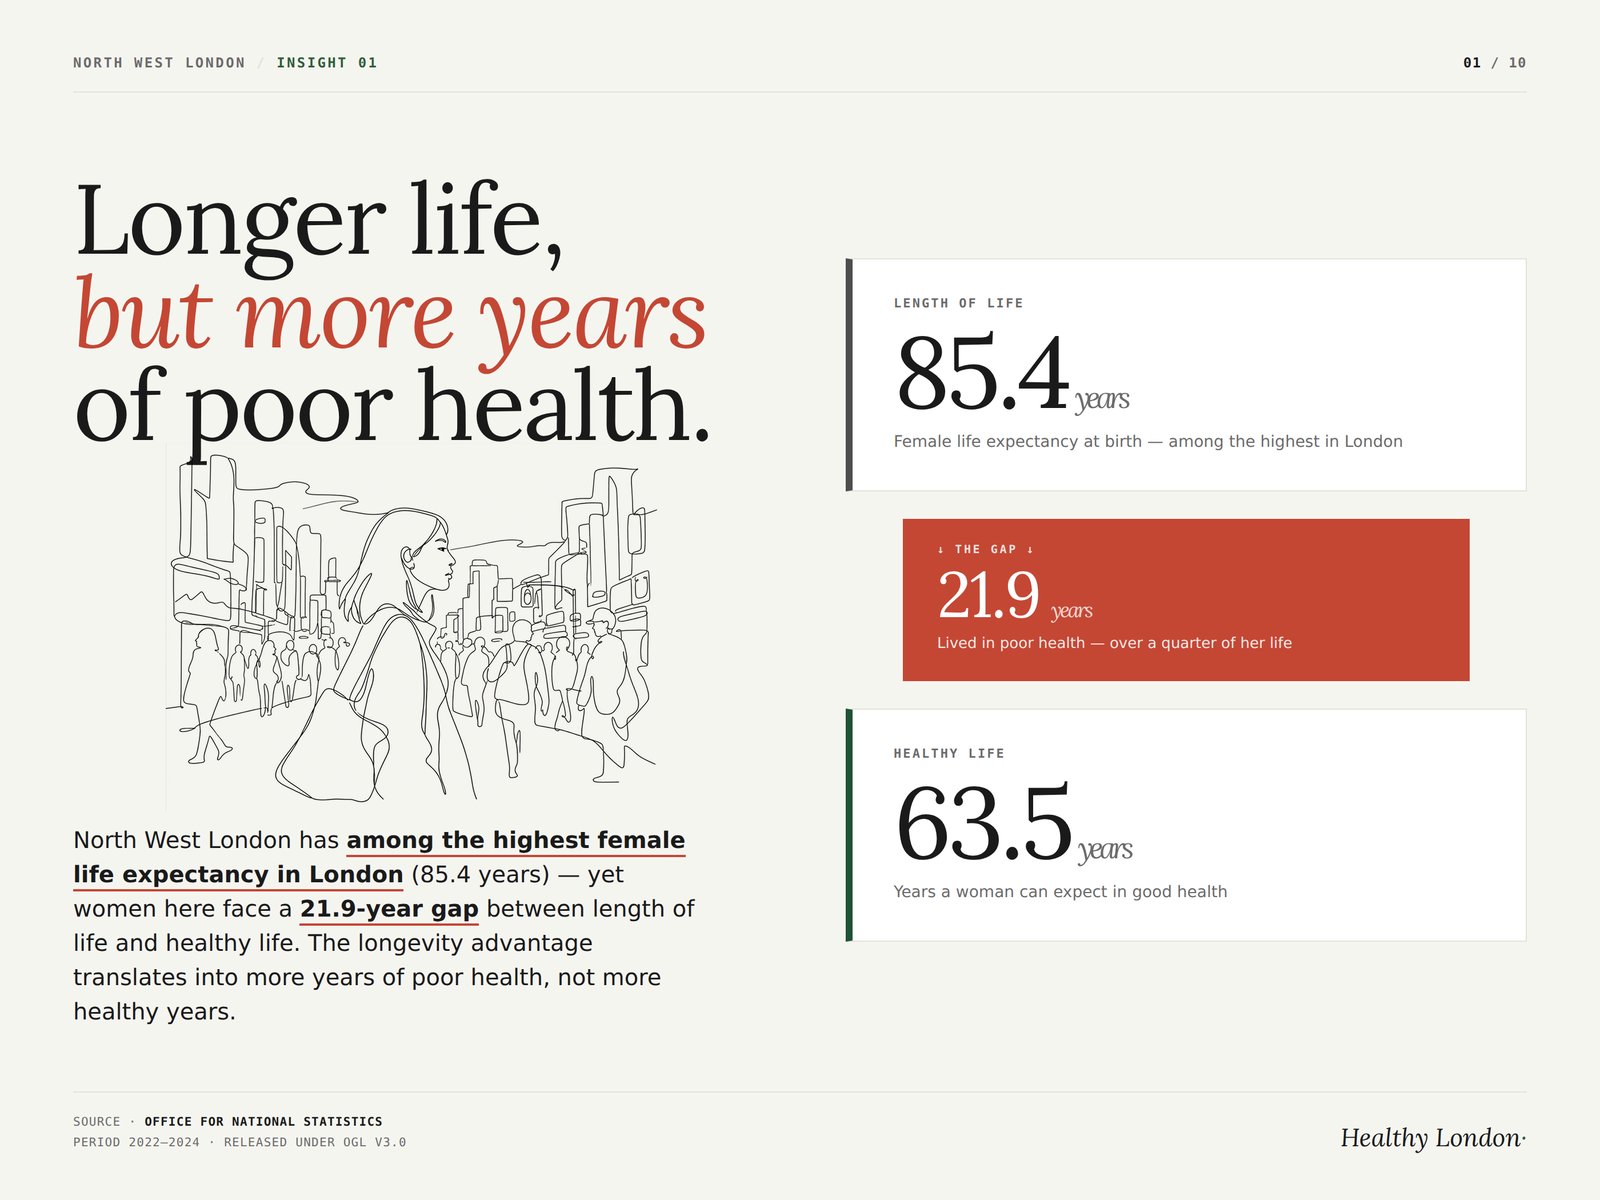
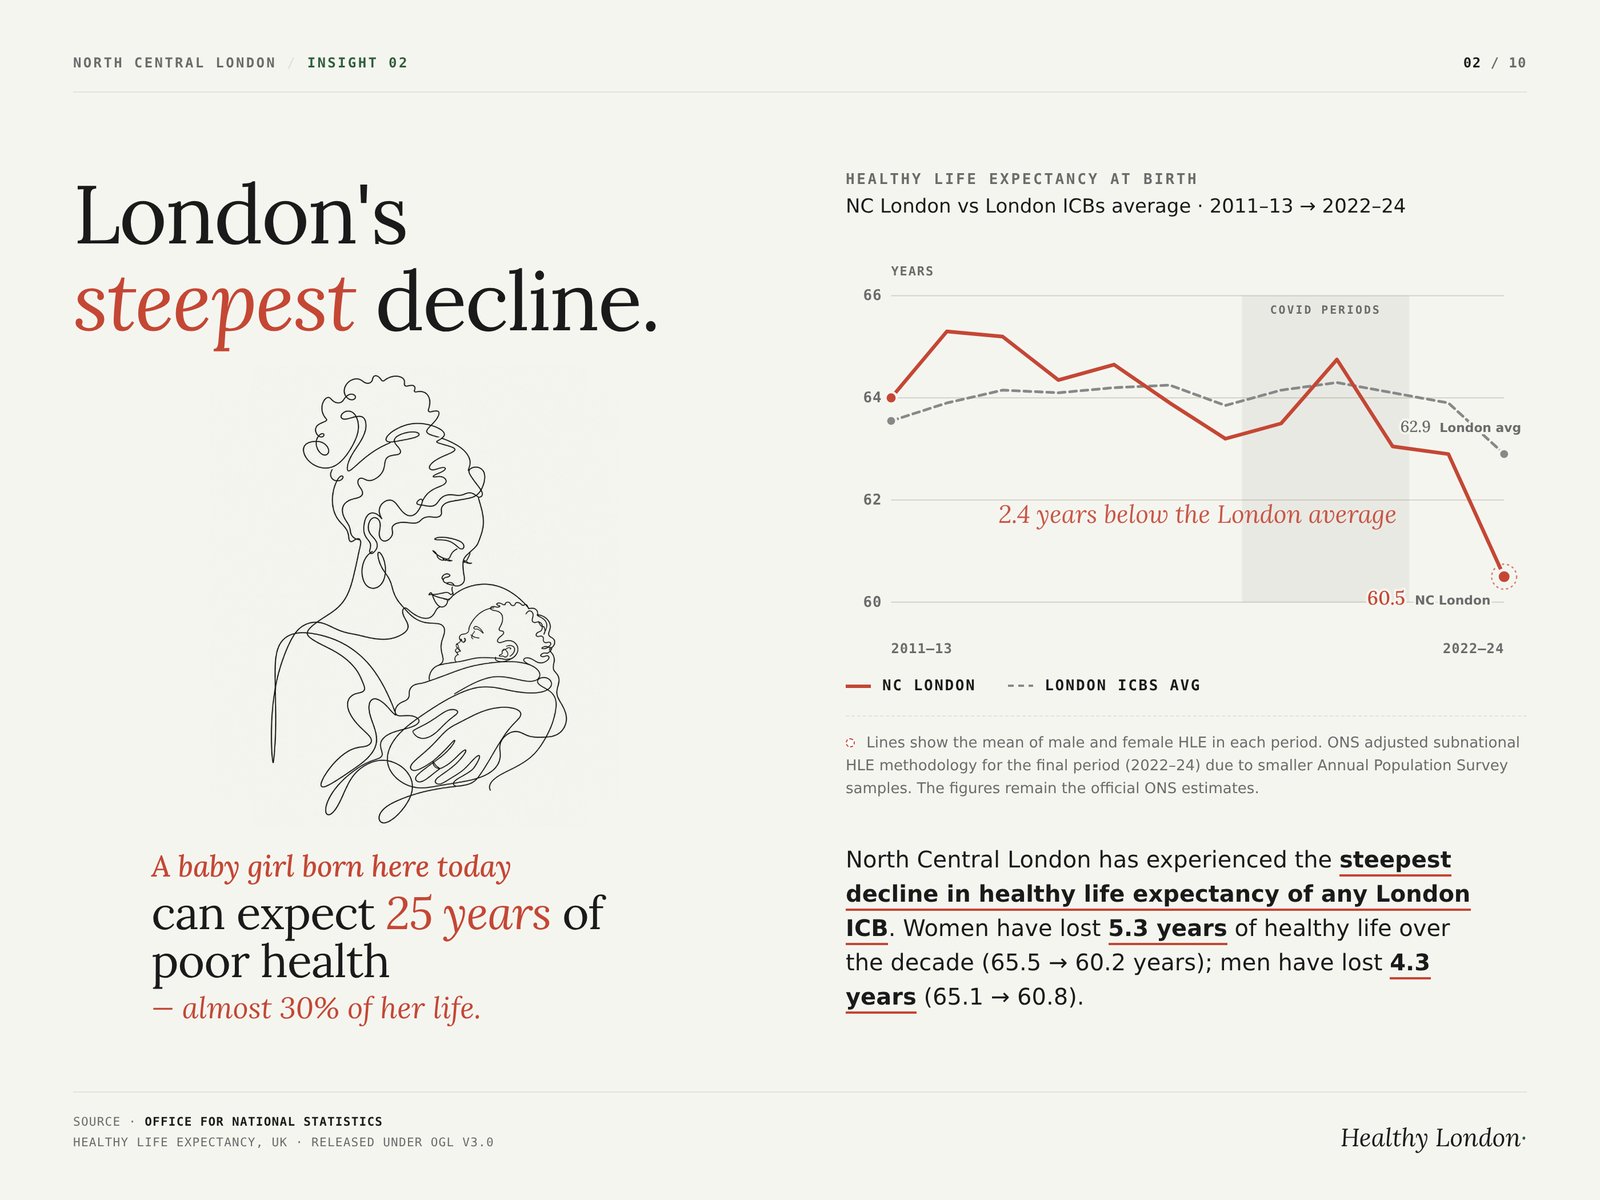
The headline question the app is designed to address is the gap between the quantity and quality of life: people may be living longer, but how many of those years are spent in good health? The dataset structures published ONS estimates so that this comparison can be made cleanly across the five London ICBs and over time.
Four ONS publications were used. All are accredited official statistics, released under the Open Government Licence v3.0.
| Dataset | Used for | Released |
|---|---|---|
| Life expectancy for local areas of the UK |
Period LE point estimates and 95% confidence intervals across 12 periods. | 10 Dec 2025 |
| Healthy life expectancy, UK |
HLE point estimates, confidence intervals, and ONS-published proportion of life in good health. | 19 Feb 2026 |
| Population estimates, mid-2022 to mid-2024 |
Sex- and age-specific population weights for the 2022–2024 period. | 7 Nov 2025 |
| Population estimates, mid-2011 to mid-2022 |
Sex- and age-specific population weights for all earlier periods, period-matched. | 25 Nov 2024 |
LE and HLE files include all five London ICBs natively. Population estimates were aggregated from Sub-ICB Locations to ICB level — ONS publishes finer-grained Sub-ICB rows that sum cleanly to ICB totals.
The five NHS Integrated Care Boards covering Greater London were selected as the geographic frame. ICBs are a meaningful unit for NHS planners and local authority partnerships, and the constraint of five comparable geographies makes the storytelling tractable for a general public audience. National and regional comparisons are deferred to future iterations.
ONS publishes LE and HLE on overlapping 3-year periods to smooth small-area volatility. We use all 12 periods that have matching LE and HLE data, giving a thirteen-year span. Successive periods share two of three years and are therefore auto-correlated; this should be reflected in trend visualisations.
The single-year LE file was reviewed and held back. ONS itself flags single-year subnational estimates as "less robust" because of annual mortality fluctuations.
Two ONS cohort-LE projection files were reviewed and excluded. They are UK-level only — there is no subnational breakdown — and mixing cohort LE (a forecast incorporating assumed future mortality improvements) with period HLE (a snapshot of current conditions) invites a category-error comparison. Period LE is the correct comparator for period HLE.
Both sexes are included throughout. For the headline view, two age groups are surfaced: at birth (ONS age group "<1") and at age 65 (ONS age group "65 to 69"). These are the two metrics ONS itself leads with, and they map onto the two policy framings the public most readily understands: "how long will I live?" and "how good will my retirement be?"
The full 20-age-group structure is preserved in the underlying dataset for future use.
The LE and HLE source files share an identical row structure (period × area × sex × age). They were filtered to the five London ICBs and the 12 overlapping periods, then inner-joined on (period, area code, sex, age group). Every join key matched.
The headline gap metric is computed at row level as LE − HLE, rounded to one decimal. ONS publishes both LE and HLE to one decimal place, so this is the most precise calculation available.
A back-calculation from the published Proportion (%) column was rejected because Proportion is rounded by ONS to whole percent, propagating roughly ±0.5 years of error into any derived gap.
A single derived row, "London ICBs average," is included for each period × sex × age combination. It is a population-weighted mean of the five published ICB-level estimates, with weights that are period-matched, sex-matched, and age-relevant ("at birth" uses total population of that sex; "at 65" uses population aged 65 and over).
Important caveat. This is a weighted mean of published outputs, not a pooled life-table calculation from underlying death and population counts. For closely-similar London ICBs the difference is expected to be small (likely under 0.2 years), but the value is labelled "London ICBs average" rather than as a pooled "London-wide" figure.
Two boolean flags are added to every row of the dataset, to be surfaced visually in the app:
| Flag | True for | Why it matters |
|---|---|---|
covid_period_flag |
2018–2020, 2019–2021, 2020–2022 | These periods incorporate excess pandemic mortality. London was hit hard in spring 2020, so LE in particular dips visibly. |
hle_methodology_flag |
2022–2024 | ONS applied an interim methodological fix to subnational HLE in this release because the Annual Population Survey sample size has fallen. The figure is the official ONS estimate but is not strictly comparable to earlier-period methodology. |
The deliverable is a single Excel workbook (london_icb_dataset.xlsx) with five sheets:
| Sheet | Purpose | Rows |
|---|---|---|
| Cover | Title, contents, source list, licence | — |
| Notes | Definitions, coverage, methodology flags, derived figures, CI notes | — |
| Table A — Headline | Primary fact table read by the app: 6 areas (5 ICBs + London average) × 12 periods × 2 sexes × 2 age groups | 288 |
| Table B — Full age | Held in reserve for future iterations: 5 ICBs × 12 periods × 2 sexes × 20 age groups | 2,400 |
| Table C — Area metadata | Static reference: codes, names, latest population, borough counts, geographic display order | 6 |
| Decision | Reason |
|---|---|
| Period (3-year) data, not single-year | Single-year subnational LE is too volatile for a public audience. ONS itself cautions against it. 3-year periods also align exactly with how HLE is published, enabling clean row-level joins. |
| Period LE, not cohort LE | Cohort LE is a UK-level forecast incorporating assumed future mortality improvements. Comparing it to ICB-level period HLE would conflate apples and oranges. |
| Two age groups initially, twenty in reserve | Twenty age groups in a public-facing dropdown is intimidating. "At birth" and "at age 65" are the two framings most readily understood. |
| London ICBs average as derived reference | Without any comparator, ICB-level numbers are unanchored. A London-5 weighted mean keeps the geography strictly to ICBs while providing the contextual reference the storytelling needs. |
| Gap = LE − HLE, computed at row level | Most precise approach available given LE and HLE both rounded to one decimal. Back-calculating from the rounded Proportion column would have been less precise. |
| Confidence intervals retained, not collapsed | CIs are wide at ICB level — typically several years. Hiding them risks implying false precision in trend charts. |
| Methodology flags as columns, not as filters | COVID-affected periods and the 2022–2024 HLE methodology break are flagged in every row but not removed. Hiding them would create its own distortion. |
The following items were considered and deliberately deferred:
Subnational HLE has wide confidence intervals. Year-on-year movements within a single ICB are often within the noise. The app must surface uncertainty (shaded sparkline band) to avoid overstating trend changes.
Overlapping 3-year periods are not independent observations. A "trend" across 12 successive periods is smoother than the underlying year-on-year change because successive periods share two of three years. This is normal practice for small-area mortality but should not be treated as 12 independent data points.
The London ICBs average is an approximation. It is a population-weighted mean of published outputs, not a pooled life-table calculation. For closely-similar London ICBs the difference is expected to be small but is documented in the data dictionary.
HLE relies on self-reported general health. HLE incorporates Annual Population Survey responses to a single self-rated health question. It is not based on clinical assessment. Cultural differences in how people rate their own health can affect cross-area comparison; this is an inherent feature of the metric.
Boundaries are 2024 ICBs, back-cast for earlier years. ICBs were established in 2022. ONS has back-cast population estimates and HLE/LE figures to 2024 ICB boundaries. The geography of the published numbers is therefore consistent across the time series, but the institutional ICBs themselves did not exist before 2022.
I am a multidisciplinary designer and consultant specializing in the intersection of human-centered design and emerging technology. Drawing on an extensive background in global healthcare and digital health strategy, I have led service design and product strategy for organizations including Babylon Health (e-Med), the National Health Service (NHS), and the Centre for Population Health.
My work focuses on translating complex data into intuitive, storytelling-led experiences. This application was developed as a "maker" project to explore the potential of AI-native development in health analytics. Utilizing Claude and Claude Code for the research, data analysis, and core engineering, I combined my background in UX research and product design with generative AI workflows to move from raw public health data to a functional interactive interface. All visual assets and interface refinements were produced through custom AI image-generation pipelines.
I am a lead-level practitioner focused on how AI can streamline the bridge between rigorous research and accessible, impactful design.
I am always open to discussing the intersection of health data, AI-native development, and human-centered design. Whether you have questions about the methodology of this app or potential collaborations, feel free to reach out.